No Consistent Declines in Nitrate Levels in Large Rivers in the Mississippi River Basin
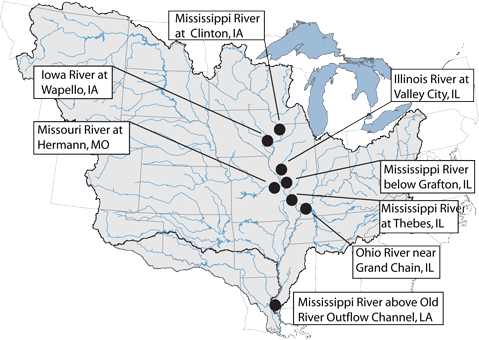
Despite efforts to reduce nitrate levels in the Mississippi River Basin, concentrations and transport at eight major study sites did not consistently decline from 1980-2008. These results are based on a new scientific model developed by the USGS that takes into account variation in river flows in order to gain an accurate understanding of long term trends. The results of the new USGS study are published in the journal Environmental Science and Technology.
“While conservation practices may have decreased nitrate levels in some portions of the basin, we aren’t seeing widespread effects at larger scales,” said Lori Sprague, USGS hydrologist and lead author on the report. “Applying this new model to decades of USGS water quality data allows us to distinguish between the effects of natural changes in precipitation and streamflow and the effects of purposeful changes in the management of nitrate in the basin.”
Excessive nutrients like nitrate in the Mississippi River Basin contribute to hypoxia, or dead zones, in the Gulf of Mexico. The dead zones are the result of too little oxygen to support most marine life in bottom and near-bottom water. State and federal partners serving on the Mississippi River Gulf of Mexico Watershed Nutrient Task Force are striving to decrease nutrients transported to the Gulf to reduce the size of the hypoxic zone to less than 5,000 square kilometers (about 2,000 square miles) by 2015.
For this new study, the USGS analyzed data from eight study sites taken between 1980-2008, including 3,368 individual water-quality samples and 110,732 individual daily streamflow values.
Major Findings:
- Nitrate transport to the Gulf of Mexico was 10% higher in 2008 than 1980. Nitrate transport during the spring is one of the primary determinants of the size of the Gulf hypoxic zone. At times of high spring streamflow during the period studied, the concentration of nitrate decreased at the study site near where the Mississippi River enters the Gulf of Mexico, indicating that some progress has been made at reducing nitrate transport during high flow conditions. However, during times of low to moderate spring streamflow, concentrations increased. The net effect of these changes is that nitrate transport to the Gulf was about 10% higher in 2008 than 1980. This increase in nitrate transported to the Gulf can largely be attributed to the large upstream nitrate increases in the Mississippi River Basin above the Clinton, Iowa site and in the Missouri River Basin.
- Nitrate concentrations increased considerably at two sites with low concentrations in 1980. At the northern-most study site on the Mississippi River at Clinton, Iowa, annual flow-normalized nitrate concentrations increased 76% from 1980-2008. Similarly, on the Missouri River at Hermann, Mo., located near where the Missouri River empties into the Mississippi River, concentrations increased 75% during the same time frame.
- Nitrate concentrations remained the same or increased at the other six sites, including those where concentrations were relatively high in 1980. On the Iowa River at Wapello, Iowa, Illinois River at Valley City, Ill., and Ohio River near Grand Chain, Ill., nitrate concentrations were virtually unchanged. Along the Mississippi River at Grafton, Ill., and Thebes, Ill., and near the Old River Outflow Channel in Louisiana near where the Mississippi River enters the Gulf of Mexico, concentrations increased 10-20%.
- Increases in nitrate concentrations in groundwater are contributing to increases in river concentrations. At most sites, increases in nitrate concentrations at low and moderate streamflows were greater than or comparable to changes at high streamflows. These results suggest that increasing nitrate concentrations in groundwater are having a substantial effect on nitrate concentrations in rivers and transport to the Gulf. Because nitrate moves slowly through groundwater to rivers, the full effect of management strategies designed to reduce nitrate movement to groundwater may not be seen in these rivers for many years.
These results reflect the cumulative changes over time in nitrate sources and conservation practices throughout the Mississippi River Basin and highlight the need for comprehensive nutrient management strategies that will reduce nutrients in both streams and groundwater.
The new method developed for analyzing these trends was critical for understanding these changes and will be used for future analysis of nutrient monitoring data collected in the basin.
“When we analyze long-term nutrient trends for the Mississippi River or other rivers, it’s important that we consider flow variations, because water quality can change greatly from year to year due to precipitation and runoff,” said Robert Hirsch, USGS research hydrologist who led the development of the new method. “This new method enables us to remove this source of variation from data and provides greater insight into the effects of conservation practices.”
The full Environmental Science and Technology article and additional information about the eight sites can be found online.
The same method of analysis was also applied to nutrient inputs to the Chesapeake Bay Watershed in a 2010 USGS report. For results of that study, visit the USGS News Release: A New Understanding of 31 Years of Chesapeake Bay Nutrient Trends.
For more information about the results at each study site, visit the National Water-Quality Assessment (NAWQA) Program website.

Leave a Reply